Less is more!
Docs as Code is an important aspect of Rust (doc-book), but integrating graphics/images as SVG or PNG into source files or markdown files has been a pain so far, 1) requiring external tooling to create/update these graphics/images, 2) requiring additional manual steps to link these images from the rust-docs rs-files or markdown files (README.md); AFAICS Rust-docs lacked support for easy to use inline graphics and diagrams.
Therefor the support for the Mermaid diagram tool (Rust module aquamarine) is a great enhancement regarding expressiveness of rust-docs and the project documentation overall! Mermaid is a tool that allows us to create flowcharts, graphs, diagrams, sequence diagrams, state machines, Gantt charts and class diagrams, and many more.
For example diagrams can be added to the documentation of functions’ rust-doc, being displayed in HTML output of cargo doc
#[cfg_attr(doc, aquamarine::aquamarine)]
/// A function showcasing aquamarine defaults
///
/// With aquamarine it's possible to embed Mermaid diagrams into your Rust documentation using the code snippets
///
/// ```mermaid
/// graph LR
///     s([Source]) --> a[[aquamarine]]
///     r[[rustdoc]] --> f([Docs w/ Mermaid!])
///     subgraph rustc[Rust Compiler]
///     a -. inject mermaid.js .-> r
///     end
/// ```
///
/// The diagram is going to be located in place of the code snippet
///
/// Dark mode is automatically enabled if `dark` or `ayu` rustdoc theme is selected.
///
/// You might need to reload the page to redraw the diagrams after changing the theme.
pub fn example() {}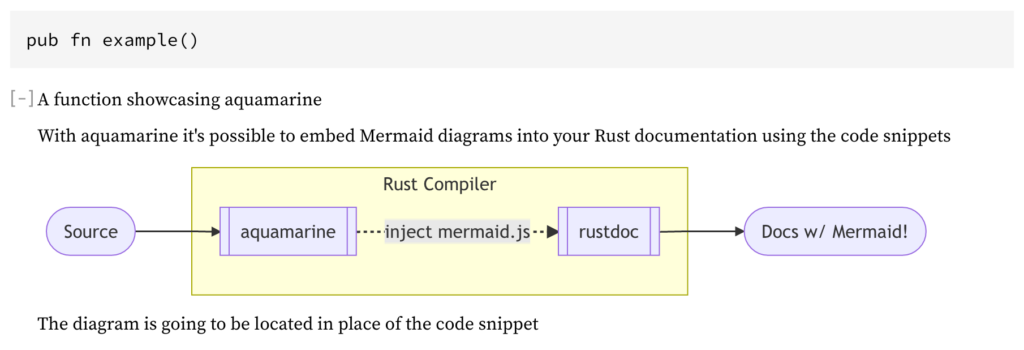
Probably you noticed, Mermaid is similar to PlantUML/Graphviz but the Mermaid rendering engine is JavaScript based, and if used in web-browser context it doesn’t need any additional interpreters or remote rendering services. Mermaid can be integrated straightly into various frameworks such as Rust-Docs, github, gitlab, Reveal.JS etc. Usually the mermaid diagram is delivered to the browser and rendering is performed by JavaScript in the Web-Browser, off-loading the web-server.
So far project teams are using a zoo of graphic tools, for example developers tent to use tools such as graphviz (or similar) but management is preferring PowerPoint, LibreDraw, Visio, or Enterprise Architect. The charts/diagrams have not been shared between groups in the project team. Graphs and diagrams have been re-created again and again with huge effort, but prettified versions never made it back from management layer back to the docs of the source code.
Well, using mermaid, now charts and diagrams can be shared between team members, no matter which position or role in the project, being improved time over time.
For example, using the crate aquamarine inline diagrams can be added to Rust source code docs directly or adding diagrams to README.md being rendered by github (github adding the mermaid JS rendering engine to the README.md HTML page and the final graph rendering happens in the Web-browser)
The following frameworks are supporting mermaid (incomplete list):
Rust-Docs: Aquamarine plugin embedding the mermaid rendering functionality into the generated HTML pages. Off-loading the rust-doc-server, rendering the graphs in user’s web-browser!
See the corresponding Rust doc
Reveal.JS: Reveal.JS is a HTML Presentation Framework. The plugin reveal.js-mermaid-plugin may be used to embed nice graphs into presentations easily, and sharing these graphs with rust-docs is possible!
markdown: github and gitlab are providing support for inline mermaid diagrams, for example the project’s README.md or the issue tickets. Sharing these mermaid graphs with rust-docs (rs-files) is possible!
For example the project’s README.md file
## Markdown Mermaid Inline
Browsing github/gitlab the following diagram in README.md would be rendered in your browser.
```mermaid
 graph LR
     s([Source]) --> a[[aquamarine]]
     r[[rustdoc]] --> f([Docs w/ Mermaid!])
     subgraph rustc[Rust Compiler]
     a -. inject mermaid.js .-> r
     end
```
command line: mermaid-cli command line tool mmdc rendering mermaid mmd-files to SVG, PNG, etc. The command line tool can be used to convert the mermaid text format into SVG/PNG to be integrated into PowerPoint or Keynote presentations. 😉
VueJS UI: vue-mermaid
Sphinx: The Sphinx Document Generator provides mermaid support
AsciiDoc: AsciiDoc is a plain text markup language for writing technical content, supporting mermaid format as well. AsciiDoc may be used for larger documents being divided into multiple files. The mermaid charts/diagrams may be shared with markdown documents. AsciiDoc is “PDF First”! So, in constrast to markdown, the asciidoc compiler will render mermaid diagrams immediately and embed them as SVGs into the PDF or HTML.
For example user-guide.adoc
[mermaid]
....
 graph LR
     s([Source]) --> a[[aquamarine]]
     r[[rustdoc]] --> f([Docs w/ Mermaid!])
     subgraph rustc[Rust Compiler]
     a -. inject mermaid.js .-> r
     end
....
WordPress: a plugin providing mermaid support in this blog as well
flowchart LR

A[This] -->|Blog| B(is)
B --> C{using}
C -->|mermaid| D[as]
C -->|well| E[happily]
Atlassian/Jira+Confluence: mermaid-charts-diagrams-for-jira
crates.io: ?? Sadly, so far not supporting mermaid (21.12.2022) 🙁 Support for mermaid would be really nice! Please support my request for this feature!
Conclusion
The documentation of a Rust project is done at various locations, 1) via rust docs in rs-files (for example main.rs), 2) but also via md-files (such as README.md), not to mention confluence etc. The former being processed during the build-process invoking cargo doc, whereas md-files being processed by the markdown rendering pipeline of github or gitlab.
Now, as Mermaid graphs are supported in many use cases now, it is possible to share/re-use graphs in rs-files, md-files, wiki and slides (reveal.js). Using mermaid, the source code documentation in rs-files, the project documentations in markdown files, wiki, and the slides of management meetings (using reveal.js) may benefit from each other’s graphs in a cyclic process (give and take).
Note! When refactoring code or implementing new features, one should grant the required time to update the documentation as part of the task/story, including graphs and class diagrams.
Sadly crates.io (the Rust package registry) does not support mermaid graphs yet (21.12.2022). Therefor, information of embedded diagrams may get lost when crates.io is extracting the crate-description from corresponding markdown file README.md; the description of a crate may become irritating when referring to the lost diagrams in the text. Supporting mermaid graphs would be a nice feature of crates.io! Please support the request for this feature! It would not add stress/load to the server infrastructure as the rendering would happen in web-browser of the user!
Using a combination of markdown and mermaid, all groups of the project team – requirements engineers, software architects, software developers, technical writers and managers – may have common ground now to share architecture/API documentation and graphs (watch), and keeping them in sync with each other using version control (git). Technical graphs/diagrams may be shared between each other and edited, without the trouble about licenses for editors, such as Enterprise Architect or Rational Rose. So far these WYSIWYG tools have failed! Either too complex or the license model too restrictive!
Last but not least, one step further! If combining markdown/mermaid documentation now with Swagger/OpenAPI as the REST-API documentation (what is swagger UI?) this sounds like a good starting point for a Rust project going for docs as code.
PS(protocol): mermaid cannot illustrate the packet structure of a protocol. In this case use https://github.com/luismartingarcia/protocol and embed its plain text output into your md-files and rs-files, for example the following rust-doc in main.rs would show up in the generated api-docs as follows. Don’t forget to add the command parameter also, if someone wants to modify it later.
/// Example
///
/// $ protocol "Source:16,TTL:8,Reserved:40"
/// ```text
///      0                   1                   2                   3
///      0 1 2 3 4 5 6 7 8 9 0 1 2 3 4 5 6 7 8 9 0 1 2 3 4 5 6 7 8 9 0 1
///     +-+-+-+-+-+-+-+-+-+-+-+-+-+-+-+-+-+-+-+-+-+-+-+-+-+-+-+-+-+-+-+-+
///     |             Source            |      TTL      |               |
///     +-+-+-+-+-+-+-+-+-+-+-+-+-+-+-+-+-+-+-+-+-+-+-+-+               +
///     |                            Reserved                           |
///     +-+-+-+-+-+-+-+-+-+-+-+-+-+-+-+-+-+-+-+-+-+-+-+-+-+-+-+-+-+-+-+-+
/// ```
fn example() {}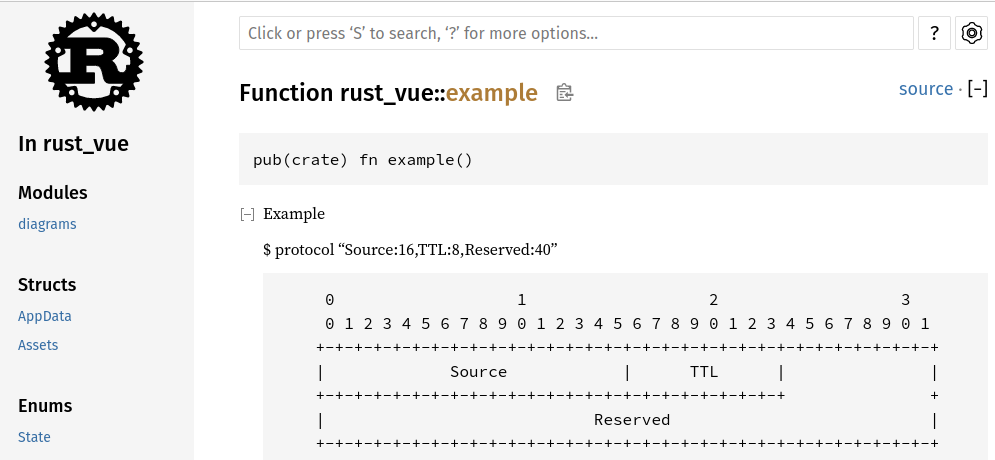
PS(TeX): For the illustration of a protocol header the TeX bytefield package may create more sophisticated SVG/PNG output, but must be linked into rs-files and md-files as image. Pretty, but avoid the hassle! The compilation of this TeX document will produce the following astonishing diagram:
\documentclass[border=10pt,png]{standalone}
\usepackage{bytefield}


\begin{document}

    \begin{bytefield}[bitwidth=1.1em]{32}
        \bitheader{0-31} \\
        \begin{rightwordgroup}{RTP \\  Header}
            \bitbox{2}{V=2} & \bitbox{1}{P} & \bitbox{1}{X}
            & \bitbox{4}{CC} & \bitbox{1}{M} & \bitbox{7}{PT}
            & \bitbox{16}{sequence number} \\
            \bitbox{32}{timestamp}
        \end{rightwordgroup} \\
        \bitbox{32}{synchronization source (SSRC) identifier} \\
        \wordbox[tlr]{1}{contributing source (CSRC) identifiers} \\
        \wordbox[blr]{1}{$\cdots$} \\
        \begin{rightwordgroup}{RTP \\ Payload}
            \wordbox[tlr]{3}{MPEG-4 Visual stream (byte aligned)} \\
            \bitbox[blr]{16}{}
            & \bitbox{16}{\dots\emph{optional} RTP padding}
        \end{rightwordgroup}
    \end{bytefield}

\end{document}

PPS: a good overview of tools https://kroki.io/examples.html